The Grid Behind Every Seating Chart
The simple trick BookMyShow actually uses to render any theatre's real seating shape: an imaginary grid, a sparse list of seats, and one crop on the frontend.
Here's the first real engineering problem this design has to solve. Anyone who has booked a movie has actually seen it: the seating chart BookMyShow shows you matches the real, physical shape of that exact auditorium. One theatre might show a wide, uneven layout with a gap in the middle; another might be a clean rectangle.
So here's the real question: what does the backend need to store, and what does it need to hand over to the frontend, so the frontend can draw the correct shape for any auditorium without hardcoding a layout per theatre?
Two tempting answers don't hold up. The first is storing an uploaded image of the seating chart, a PNG or an SVG — a picture can show any shape, so this feels like it should work. But a picture is just pixels, not data: there's no way to know which seat is already booked, and no way to make a seat clickable, since a picture has no idea where one seat ends and the next begins.
The second is just naming every seat, like 1A, 1B, 2A. A name tells you which seat it is, but nothing about where it sits, so it can't show a gap, a curve, or a row that's shorter than the one above it.
Neither one gives the frontend what it actually needs. The real answer is much simpler than either one.
Imagine One Big, Empty Grid Behind Every Auditorium
Picture an imaginary grid sitting behind every auditorium, 100 rows by 100 columns. At first it's just empty space, like a big sheet of graph paper, representing nothing real yet.
When a theatre admin sets up a real auditorium, they place each real seat onto one cell of that grid. A seat might sit at row 2, column 3. Another at row 2, column 4. Another at row 7, column 10.
Those row and column numbers aren't what a customer sees printed on the seat. They're just coordinates on the virtual grid, nothing more.
What the Backend Actually Stores
This is the whole trick, and it's almost anticlimactic: the backend just stores a list of seats, and each seat has a row number and a column number. An Auditorium holds a list of Seat objects, and each Seat holds nothing but its own row and column. No image, no layout diagram, no shape data of any kind.
When the frontend asks for an auditorium's seats, the backend hands back exactly that: a flat list, something like { row: 2, col: 3 }, { row: 2, col: 4 }, { row: 2, col: 8 }, and so on.
The Frontend Does the Actual Drawing
Here's where it gets clever. The frontend takes that flat list and rebuilds the same grid on its own side, with seats marked in the same cells.
The grid itself is 100 by 100, but a real auditorium only ever fills a small patch of it. Drawing the whole empty grid would waste most of the screen on rows and columns that never had a seat in them, so the frontend crops down to just the part that matters first:
- Find the smallest rectangle that contains every seat. Scan the filled cells for the topmost row, the bottommost row, the leftmost column, and the rightmost column. Those four numbers define a rectangle.
- Throw away everything outside that rectangle. None of it has a seat in it, so there's nothing to draw there.
- Draw only what's inside the rectangle.
Say the topmost filled row is 2, the bottommost is 7, the leftmost filled column is 3, and the rightmost is 10. That's the rectangle: rows 2 to 7, columns 3 to 10. Everything outside it disappears, and only that box gets drawn.
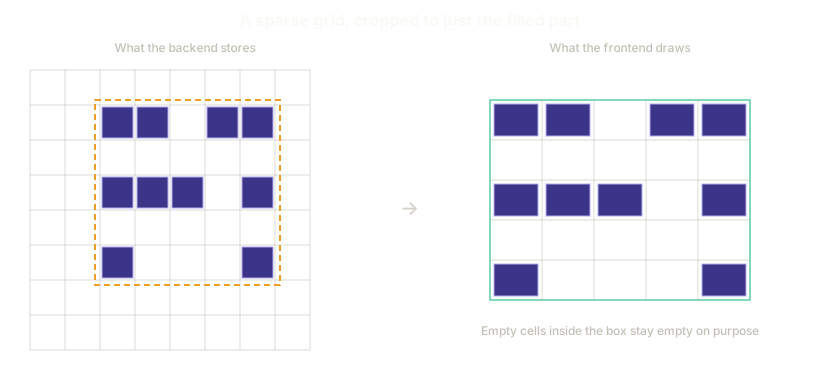 ExpandA sparse grid of seat coordinates gets cropped down to the smallest rectangle that contains all of them, with any empty cells inside that rectangle staying empty on purpose
The Empty Gaps You've Actually Seen Aren't a Bug
Here's the payoff, something you've probably already seen on BookMyShow without knowing why: a seating chart sometimes shows a blank gap mid-row, even though no seat was ever placed there.
That gap is real. It's a cell inside the cropped rectangle that never had a seat in it. It survives the crop because it sits between two filled cells, not outside the outer boundary.
Those gaps usually mean something too: a staircase, or extra spacing around a seat with a clean view of the screen. The backend never has to explain why the gap exists. It just never places a seat there, and the frontend's crop naturally leaves the space empty.
Why Row and Column Together, Not Just a List Per Row
One more idea worth ruling out: why not just group seats by row, without tracking each one's column?
Without a column number, there's no way to tell the frontend that seat three in one row lines up under seat five in the row above it. There's no way to show a two-seat gap in the middle of a row either. Row and column together are what let two different rows line up correctly, and what let a gap sit exactly where it belongs.
The Same Trick Is Running Your Screen Right Now
If this feels like an unusual idea, it isn't new. It's exactly how the screen in front of you works.
A display is just a big grid of tiny dots, pixels. Every letter, every curve, every image you've ever seen on a screen is just some of those dots colored in and the rest left alone.
Nobody draws a curve directly. The grid is what makes any shape possible, one dot at a time.
The seat matrix does the same job, just at a much coarser resolution: a big, boring, empty grid, with just enough of it filled in to represent one specific auditorium.
Keep reading